Our Impact
Harnessing the power of wind and sun
For almost 20 years, Heritage Sustainable Energy has been committed to providing clean, renewable energy sources to the people of Michigan.
Wind Sites
Solar Sites
Green Energy
Heritage has developed 5 Wind Energy farms and 6 Solar Photovoltaic sites around Michigan totaling over 220MW of green energy potential. Heritage is proud to say we were the first to develop a utility scale wind farm as well as one of the first utility scale solar facilities in the State of Michigan. Heritage will continue to be at the forefront of green energy installations in Michigan and throughout the US.
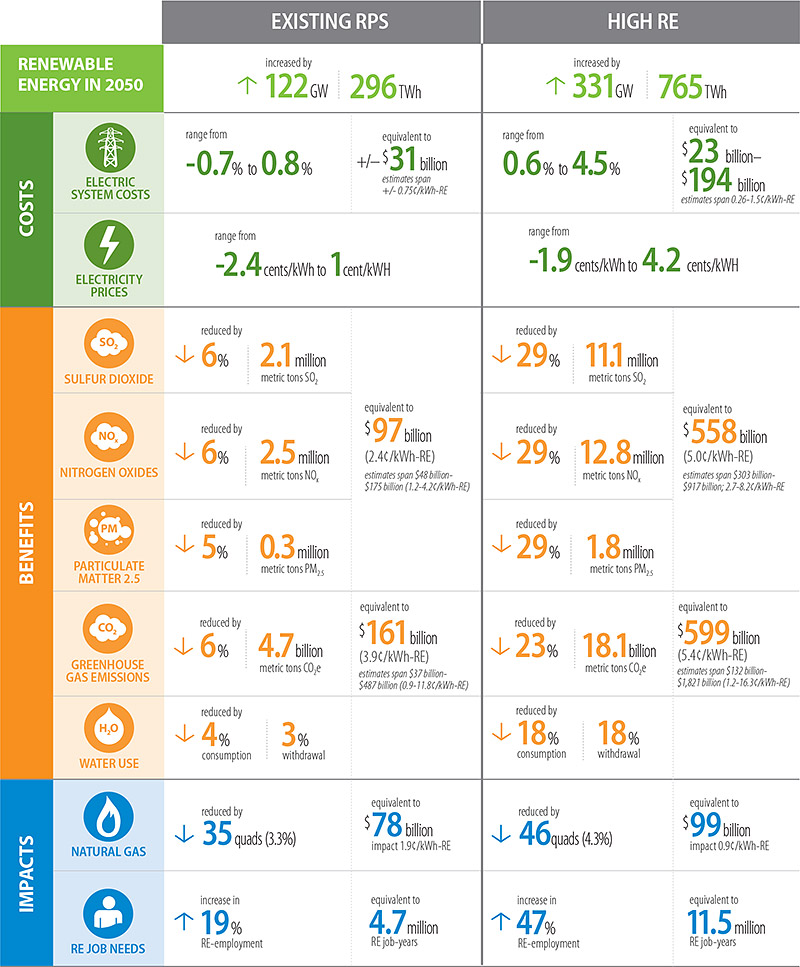
Relying on a well-vetted set of methods, the study evaluates the costs, benefits, and other impacts of renewable energy used to meet future RPS demand growth over the 2015-2050 period.
Solar Energy Facts

- Assuming intermediate efficiency, solar photovoltaic (PV) modules covering 0.6% of U.S. land area could meet national electricity demand.
- PV module prices have declined to $0.52-$0.61/Watt in residential systems. 15 The U.S. manufactured 1% of PV cells and 3% of PV modules globally in 2019.
- In 2020, a new record high of over 19.2 GW of solar photovoltaic capacity was added in the U.S., raising total installed capacity to over 97 GW. Solar accounted for 43% of new generating capacity in 2020.
- The U.S. Department of Energy’s SunShot Initiative aims to reduce the price of solar energy 50% by 2030, which is projected to lead to 33% of U.S. electricity demand met by solar and a 18% decrease in electricity sector greenhouse gas emissions by 2050.
Wind Energy Facts

- U.S. onshore wind resources have a potential capacity of almost 11,000 GW and current installed capacity of 117.7 GW. Offshore wind resources are potentially 4,200 GW, current capacity is 42 MW, and the development pipeline contained over 28 GW of projects in 2019.
- Over 16 GW of wind capacity was installed in the U.S. in 2020, a 85% increase from 2019.
- The federal production tax credit (PTC) significantly influences wind development, but cycles of enactment and expiration lead to year-to-year changes in investment.8 In 2020, the PTC was extended to allow wind projects beginning construction in 2020 or 2021 a PTC at 1.5¢/kWh for 10 years of electricity output.
- Based on the average U.S. electricity fuel mix, a 2.42 MW wind turbine (U.S. average in 2018) can displace 4,807 metric tons of CO2 emissions per year.10 By 2050, 404 GW of wind capacity would meet an estimated 35% of U.S. electricity demand and result in 12.3 gigatonnes of avoided CO2 emissions, a 14% reduction when compared to 2013.
See what the EIA says about the Benefits of Renewable Energy here – Renewable energy explained – U.S. Energy Information Administration (EIA)
The below Wind and Solar bullets are sourced from here – https://css.umich.edu/factsheets/us-renewable-energy-factsheet
![]()
![]()